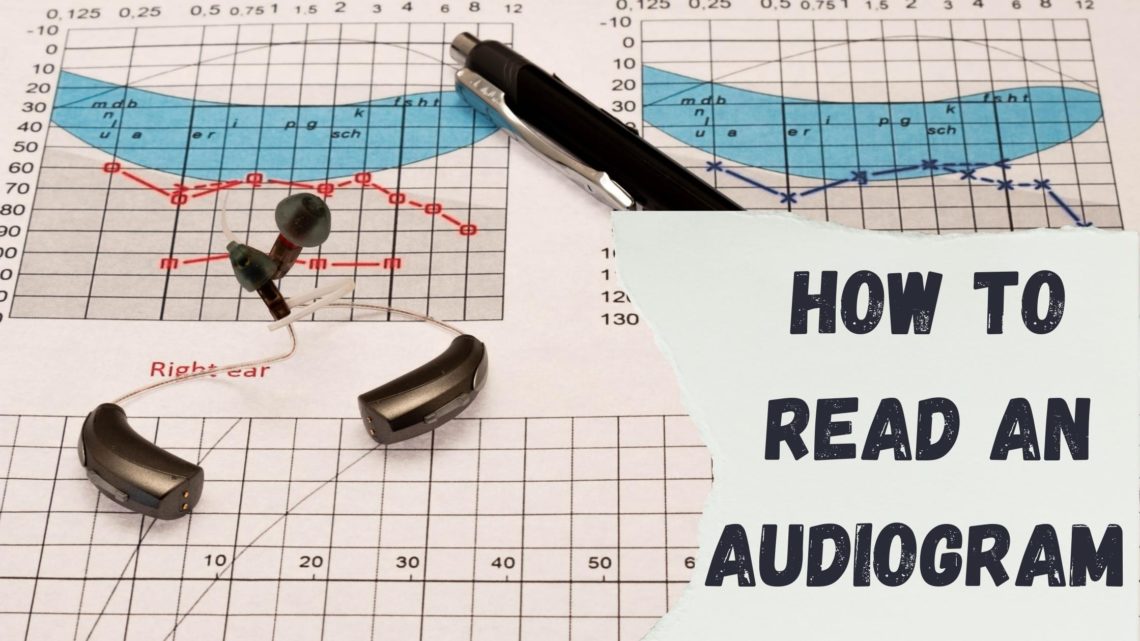
An audiogram is a graph that captures the results from your hearing test. Your hearing healthcare provider will thoroughly review your results using the audiogram which maps your hearing ability in both ears. Looking at this visual representation, which includes different lines and symbols, may be strange and illegible to you at first. Know that this is normal and once you learn how to read this chart, you will better understand the specifics of the hearing impairment you are experiencing. Having a solid understanding of your results is an important way to prioritize and take charge of your hearing health!
Measuring Hearing Ability
Typically, a hearing test involves a painless process where you wear headphones in a quiet room (or sound booth). The headphones are connected to an audiometer, a machine that plays sound at various frequencies. Guided by a hearing healthcare expert, you will respond to what you can hear. This information is collected and graphed on an audiogram. The audiogram will indicate your hearing thresholds (for each ear) for sound at different pitches. A hearing threshold is the softest sound you are able to hear at least 50% of the time. This information reveals your hearing capacity, specifically, the degree of impairment that is present in each ear.
Reading an Audiogram
Taking an initial look at an audiogram will show you a graph that has two lines with plotted points across two axes. One line represents the right ear and the other line represents the left ear.
- Horizontal Axis: or the x-axis, represents the frequencies (also referred to as pitches) of the sound presented to you. There are numbers at the top of the graph, ranging from lowest to high: 250 to 8000 which are measured in hertz (Hz). A useful way to think about this axis is imagining keys on a piano. These keys go from lower pitched to higher pitched as they are played from left to right.
- Vertical Axis: or the y-axis (the left side of the graph), represents the intensity (or loudness) of the sound presented to you. The numbers that line this side range from -10 to 110 and are measured in decibels (dB) – the unit sound is measured in. The lowest level (-10) is at the top of the chart. Zero decibels does not indicate the complete absence of sound but rather, the softest degree of sound that a person without hearing loss is able to hear at any frequency.
- Symbols: there are two lines on the chart:
- red: marked with O’s and represents the right ear
- blue: marked with X’s and represents the left ear
Each symbol (O and X) that is graphed on the chart represents your threshold for each frequency of sound. Several hearing thresholds are marked on the map and are connected, establishing an easily readable line for each ear. If these lines overlap, that shows that your hearing loss is the same or similar in both ears (symmetrical). Whereas, if the two lines are further apart, then you have different degrees of hearing loss in your ears (asymmetrical).
Now that you have an understanding of how your hearing capacity is mapped on this graph, the other part of understanding an audiogram is knowing about what the numbers mean or how hearing loss is categorized.
Categories of Hearing Loss
Healthy hearing ability for an adult is classified as hearing sounds between 0 and 25 decibels across frequencies. For a child, it is between 0 to 15 decibels. Results below this indicate some degree of hearing loss at the specific frequencies mapped out on the audiogram. Degrees of hearing loss are generally categorized as the following:
- Mild: defined as hearing thresholds in the range of 25 – 40 dB.
- Moderate: defined as hearing thresholds in the range of 40 – 55 dB.
- Moderately Severe: defined as hearing thresholds in the range of 55-70 dB.
- Severe: defined as hearing thresholds in the range of 70 – 90 dB.
- Profound: defined as hearing thresholds above 90 dB.
Your audiometric results will readily categorize your hearing loss which allows us to recommend the most effective treatment option. Be sure to keep a copy of your results which establishes a baseline for your hearing health.

